Data Analysis: Healthcare Workforce Composition Study
More medical students are choosing a quicker, more affordable route to care.
By 2030, this shift will change the composition of America’s primary healthcare workforce.
GOALS
We set out to understand medical care provider trends with a heavy focus on the growth of APCs (Physician Assistants and Nurse Practitioners) within the industry. Our hypothesis: APC employment is rapidly increasing while traditional physician employment stagnates. Secondary hypothesis: APCs will eventually overtake traditional physicians in primary care.
METHODS
For this research, we used Bureau of Labor Statistics (BLS) data. Two separate surveys were utilized: the OEWS (Occupational Employment and Wage Statistics) and CPS (Current Population Survey). I cleaned the data in Python and then built a SQL database to query for further investigation. I then accessed the data in Tableau to visualize my findings. See the tools I created on my github.
Tools used:
Python - data scraping, cleaning, analysis.
PostgreSQL - data exploration, statistical analysis, cleaning, database creation.
Tableau - data exploration, visualization.
RESULTS
Physician Assistants and Nurse Practitioners will grow substantially faster than traditional physicians between 2020 and 2030. Physician Assistants will grow at a rate of 31% and Nurse Practitioners at a rate of 52%. In that same time frame, traditional physicians will only grow 3.5%. This finding required further investigation into how the makeup of the medical provider industry will change over that time. We identified what areas of the industry will see increased employment the most as well as understanding areas that are stagnating.
As of 2021 the BLS lists 727,000 physicians, 220,300 NPs, and 129,400 PAs as employed in 2021. In total there are approximately 1.1 million medical and surgical providers for a population of 331,449,281.
Each year the BLS offers a 10-year forecast on likely growth in any industry. The 10-year prediction (2020 – 2030) for physicians is 3.5%, for NPs is 52.2% and for PAs 31%
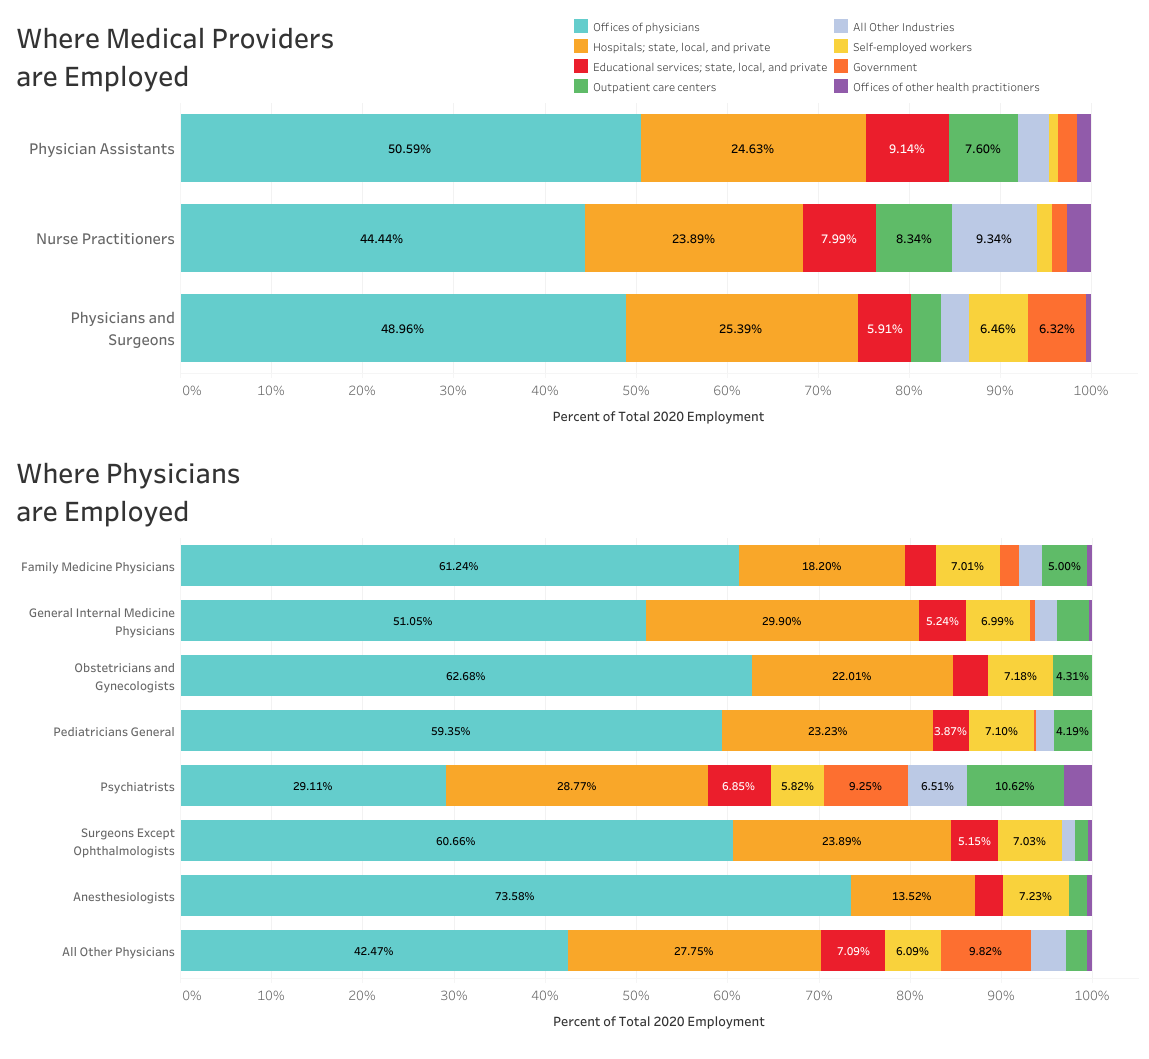
Where clinicians are employed is described by industry or clinical setting. For all three providers the largest employment location is ‘offices of physicians’ (PA: 50.59%; NP: 44.44%; MD/DO 48.96%). This is followed by hospitals as employers (PA: 24.63%; NP: 23.89%; MD/DO 25.39%), and outpatient care center staff (PA: 7.6%; NP: 8.34%; MD/DO 3.19%).
Additional details where physicians are employed is displayed in the second half of the figure below. Those locations differ with all specialties (e.g., family medicine, general internists obstetricians and gynecologists, pediatricians, surgeons, and anesthesiologists predominately reside in office-based settings and psychiatrists in outpatient centers). ‘Office of physicians’ is a location owned by a physician or physician group. Outpatient care centers can be clinics such as Federally Qualified Health Centers or ambulatory care centers associated with a hospital or corporation. “Self-employed” are counted separately from wage and salary workers.


